Mobility and spending survey 2024
Background
The relationship between mobility and spending generates much discussion in practice between entrepreneurs, property owners and municipalities.
Entrepreneurs mainly see the importance of car visitors and parking spaces because of spending.
Municipalities often want fewer cars and parking spaces in order to make city centres more attractive, greener and more sustainable.
Moreover, parking spaces cost a lot of space, which is scarce in a densifying city and where space for time to stay must also be realised. The task is to optimise the liveability and attractiveness of city centre areas for residents and visitors in good cooperation.
A great deal of research has already been done into the relationship between mobility and spending. What Platform Inner City Management and research partners BRO and Movares have noticed is that these studies are often based on a single interest, are incomplete and/or unsubtle. In order to have an 'honest' discussion on this subject, Platform Binnenstadsmanagement, BRO and Movares have joined forces to conduct this research.
Introduction
Mobility is hot. Hot in the sense that almost every city centre area is struggling to fit mobility into a densifying city. Hot in the sense that the emotions often run high in discussions. And space is scarce due to an increasing need for housing, public accomodations and attractive public space. Good accessibility for everyone to city centre areas is becoming increasingly important. With this research, the authors tried to write something down that contributes to the debate.
Note: this article is a liberal extract and translation of the Dutch publication Verplaatsings- en Bestedingsonderzoek 2024.
Connections and coherence
This research shows many interrelated relationships between indicators. The most important ones can be summarized as follows.
Mobility choices are strongly related to provenance, convenience and travel time.
Travel is a necessary evil.
People usually choose the fastest and easiest option.
Trends show that 'convenience and efficiency' are increasingly important to visitors.
The 'effort' one is willing to put into traveling to a city centre area is related to the attractiveness and the quality and diversity of the offer. For large city centres with a lot of supply and diversity, people are willing to make more effort (travel longer), than small city centre areas with a shopping function.
Visitors on foot usually come from the immediate area with a average travel time of about 12 minutes, visit the city centre more frequently, stay relatively short, and spend less per visit. Pedestrians are strongly tied to city centres because of the proximity often have no logical alternative.
The average travel time of visitors by bicycle is similar to pedestrians, but they can travel a longer distance. A visitor by bicycle is therefore mostly from the immediate area. Compared to pedestrians, cyclists visit slightly less often, but spend slightly more per visit. Cyclists are also relatively strongly tied to the main city centres in their home town.
The average travel time of visitors by car is much higher at about 30 minutes. This is comparable to public transportation. Logical, because city centres with a large catchment area attract many visitors from further away.
Car visitors come less often, but when they do, they spend the most.
This is related to the longer length of stay and the ability to easily take more things with them.
However, car visitors are much less tied to one city centre area, because they have more alternatives within the same travel time.
Many differences between city centre areas
The differences between city centre areas are great. Each city centre has its own functional mix and appeal, and therefore a different catchment area.
Making uniform black-and-white statements is therefore unwise and does not contribute to the challenges facing city centre areas. It is tempting to draw one conclusion or pick one figure from this report and link the entire mobility policy to it. There is often 'cherry-picking' or 'selective shopping' of facts and results. Our advice is to carefully consider and understand all the 'separate' puzzle pieces. Those puzzle pieces together determine what the final puzzle should look like. Nuance should be the starting point in the discussion.
Understand all puzzle pieces, add nuance in discussion

Battle for space
Pressure on physical space in city centre areas and inner cities is increasing. Space is scarce, so must be used more efficiently to accommodate all space claims. The goal should be a good balance between different interests for that space. After all, if you overshoot one interest, it may come at the expense of another. Ultimately, this can be at the expense of the economic vitality, liveability and attractiveness of a city centre area.
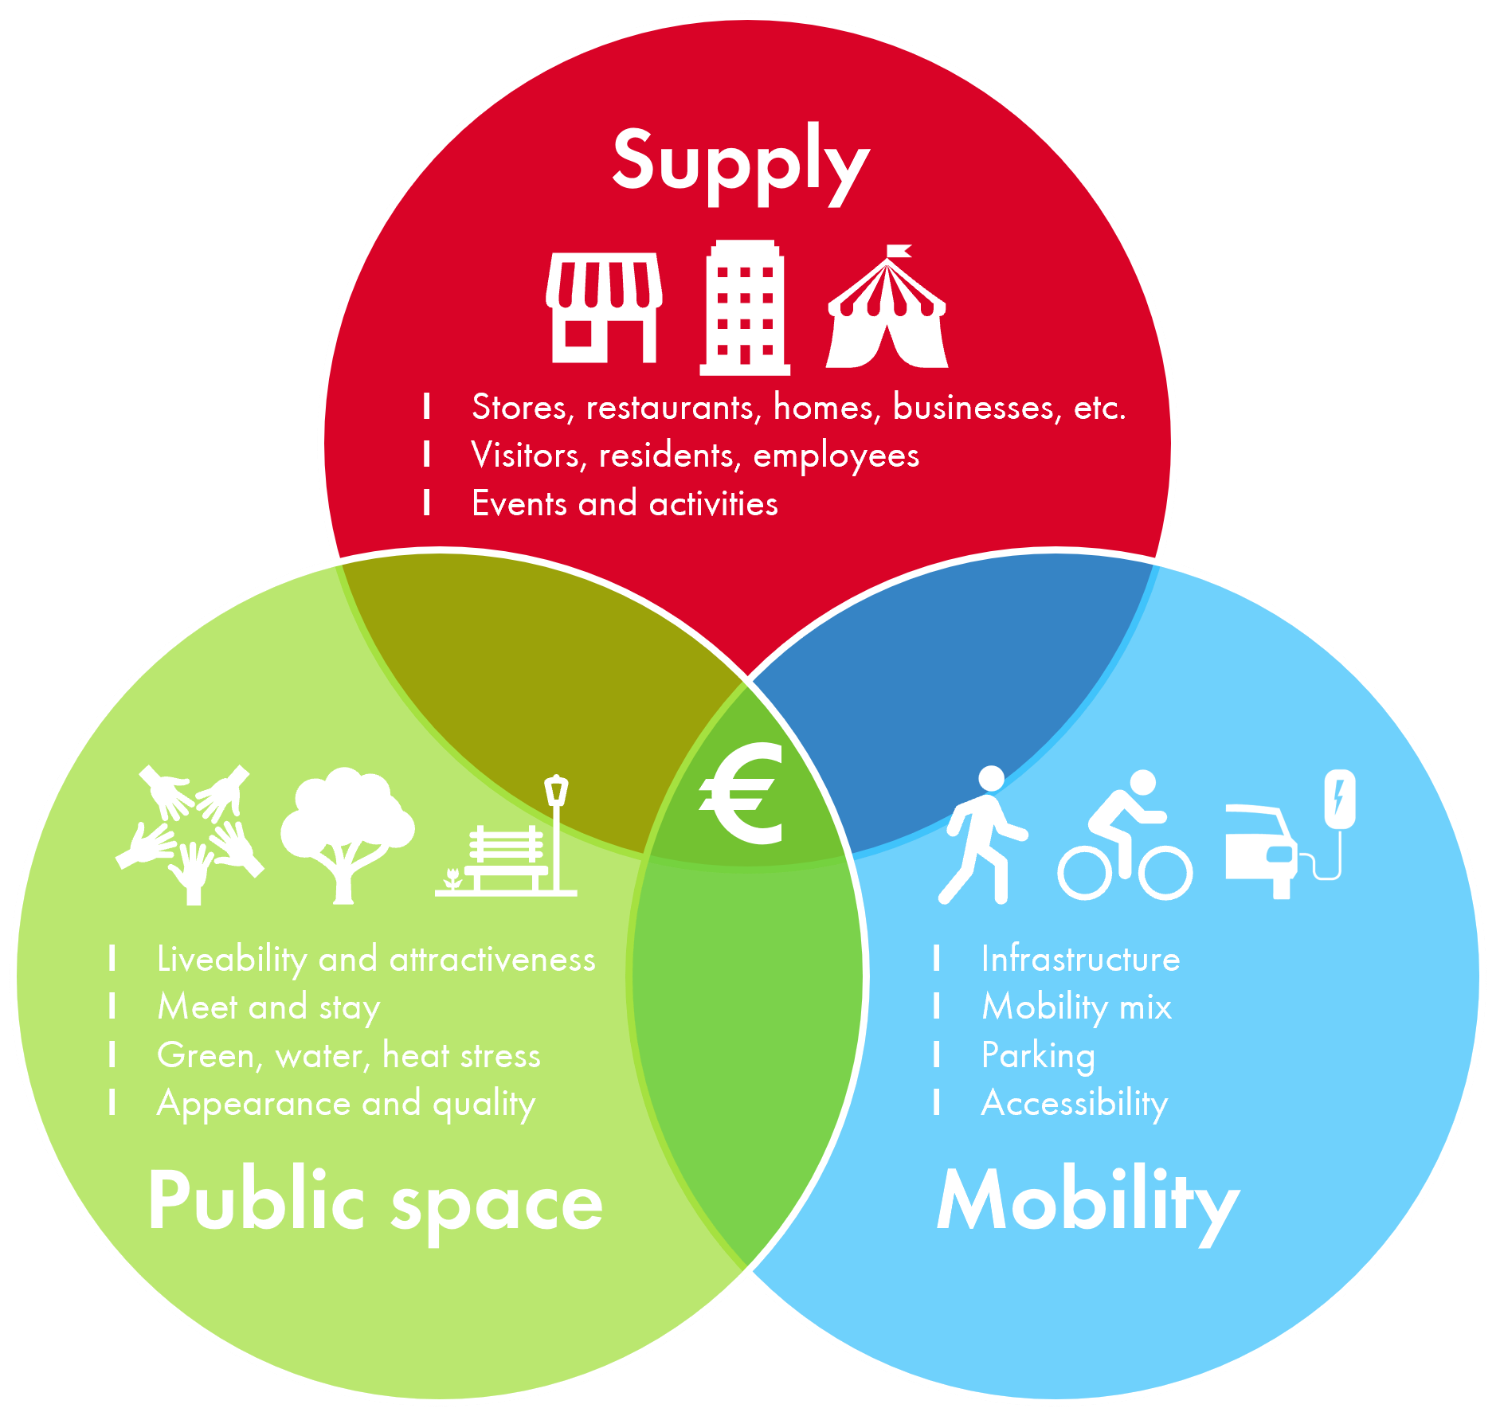
Supply: Buildings in the city centre facilitate functions such as commercial and community accomodations, businesses and residences. Supply increases and the mix of functions broadens. Buildings and functions are being added. This leads to more residents, visitors and spending. Events and the weekly market also contribute.
Public space: City centre areas are increasingly becoming places to stay and meet. They must be attractive areas where people like to come. Liveable centres for visitors and residents. We need space to meet, for terraces, seating, greenery, climate issues, etc. A good liveability leads to a more attractive city centre area and therefore to more spending.
Mobility: Accessibility of a city centre area is essential to fulfill its economic and social function.
Mobility means accessibility for all target groups, fast and comfortable travel and sustainable solutions.
A pleasant travel experience through a good mobility mix means more spending, provided there is enough to experience/offer.
Space is needed for parking, public transport, bicycle and freeway lanes, pedestrian areas, etc.
However, mobility is not a trigger. It does not add unique value but it can create resistance. If the travel experience is not optimal, convenient and efficient, people quickly choose better alternatives such as another city centre area or the internet.
Balance of economic vitality for city centre areas
What is a good balance?
There is no generic magic formula for an optimal spatial balance between supply, public space and mobility. This depends on the nature of the city centre area. Thereby, the aforementioned three space demands and city centre areas are constantly changing due to trends and developments.
Many municipalities are drafting and implementing car-free mobility policies in city centre areas. Mobility measures are 'traditionally' tested for their effect on accessibility and safety, but the domain 'economic vitality' is not explicitly part of impact assessment; while this is of great importance for a city centre area.
There must therefore be accounted for effects on the economy c.q. spending before mobility policies are set and mobilisation interventions are made.
This study provides the building blocks and insights to capture these effects. The effects of mobility measures must be considered in conjunction with supply and public space policies and measures. The desire to add more housing and green space, for example, means more pressure on parking capacity. At the same time, a different supply and more attractive public space also offer opportunities to more visitors.
Travel is a necessary evil
This research shows that mobility behaviour is strongly related to the nature and size of a city centre area. The choice of transportation mode is primarily based on convenience and efficiency. The trip to get somewhere is a necessary activity and should be as easy as possible.
A visitor sees the trip to a city centre area as a burden. It is an action as well as an expense, necessary to do a worthwhile activity. For a city centre area where there are many activities and functions, people are willing to put more effort in than for smaller shopping centres. Travel time may 'cost' more (in time and/or money). The car has the largest space claim, but makes a significant contribution to revenue in most cases.
If you want people to come more on foot, by bicycle or by public transport, this is only going to work if these modes are an easier and more logical alternative for a visitor. Based on this research and practice, you can only entice a portion of visitors to choose another mode of transportation.
Behavioural changes are difficult to achieve in a general sense. Only a wellconnected package of mobility can achieve this. Even then, it will not be easy. Transport behaviour is very much a matter of habit. People only start thinking about other transport behaviour when a 'calamity' occurs. Only when that new behaviour is 'ingrained' and situations are permanent and structural, can a permanent adaptation be expected.
Travel = necessary evil - choices based on convenience

Reality versus wishful thinking: who can I seduce?
The 'gain' you can make in shifting transport mode choice (modal shift) is greater for one city centre area than another. If you attract many visitors from further away (regional function), there is little chance that you can entice these people to walk or cycle. The travel time then simply becomes too great. Public transportation is a logical alternative only if it provides convenience and efficiency over car and cost.
Note: the cost of the car often only looks at the out-of-pocket costs (fuel, parking). For a pure comparison, the total cost should be looked at (maintenance, insurance, tax, depreciation).
If you have a lot of (car) visitors from the immediate area, there is a greater potential to entice (some of the) people to leave the car (occasionally) and come by foot or bicycle instead. With this study, this can be further analysed per city centre. However, this involves customisation.
Degradation risk: first the sweet, then the sour
Moreover, the risk of harm must always be taken into account. By this we mean the chance that certain visitors will stop coming because of the (poor) accessibility and go to another city centre or buy online. Poor accessibility increases resistance. Large city centre areas with few direct competitors in the area have a lower risk of deterioration than medium and smaller centres that are visited mainly for shopping. Neighbourhood and community centres in the immediate area are quickly more convenient and efficient alternatives for visitors.
To minimise the risk of detriment, a coherent package of measures must always be deployed. In terms of sequence of implementation, the sweet should be deployed first and only then the sour.
By sweet we mean positive interventions that for example benefit pedestrians, cyclists, public transport and/or encourage P+R-like structures.
Only when the sweet is in order can the sour take effect, such as shrinking parking capacity, introducing or raising parking fees or limiting car accessibility.
A good relationship between sweet and sour is also important to influence behaviour. In other words, you need both sweet and sour to change behaviour. For example, a P+R construction is not going to work if you still have easy and reasonably cheap parking in a city centre. Again, people usually choose the easiest alternative.
People usually choose the easiest alternative

Consider different types of car visitors
You will also have to consider different target groups coming to the city centre in mobility policy. Zooming in on car visitors, there are roughly three groups of car motorists:
targeted visitors who want to be specifically (briefly) near a certain shop/business/function and prefer to park their car in front of the door or very close,
the 'shopping public' who often know the city centre and prefer to park nearby in a city centre car park and also accept the costs,
the occasional 'well-organised tourist' who is willing to visit a P+R and thus to make a little more effort.
Depending on the type of city centre and the function mix, you want to facilitate all these (car) target groups to a certain extent. Good car accessibility can go well with spatial quality by realising parking in strategic places, more on the edge of the city centre. In short: good car accessibility does not have to equate to a lot of car infrastructure in the central parts of the city that detracts from quality.
Link mobility policy to broader city centre vision
Mobility goals and measures should never stand alone. Mobility should explicitly be part of a city centre vision or city centre plan: the strategic vision of the city centre area that is prepared in cooperation with all stakeholders. Mobility choices must be justifiable from the integral goals and ambitions.
How does this contribute to an attractive city centre area?
How does this strengthen economic functioning?
What are the effects?
A unique pedestrian yields the most spending....
This research shows that visitors who live close by come relatively often and therefore spend more money and contribute significantly to the economic functioning of city centre areas. These visitors usually come on foot or by bicycle.
If, as a city centre area, you manage to attract more of these people, it is very positive for economic functioning. Not only because on average they spend more, but also because they are strongly tied to the city centre (there is no logical alternative).
Visitors from further away are more likely to come by car (or public transport) and tend to be the most important group in the share of total sales. However, you need many more unique visitors. In general terms, in terms of total sales, about 1,000 car visitors are equivalent to about 500 pedestrians.
From national shopping stream surveys and trends it shows that the regional function of many (medium and small) city centre areas is shrinking. This means that it becomes increasingly difficult to attract unique visitors from further away. Moreover, these visitors often have more alternatives at equal distance, which means you lose these unique visitors faster (shrinking catchment area). A strong economic dependence may be a given at the moment, but could quickly crumble.
To answer the question of which mode of transportation is most important in total sales, it is not only about the spending of unique visitors on a monthly basis. It is also about the total number of visitors attracted (visiting units).
... but the car is most important in share of revenue
A city centre that manages to attract proportionately more unique car visitors than unique pedestrians will, on average, be more dependent on cars in total sales and vice versa. On average, for all centres:
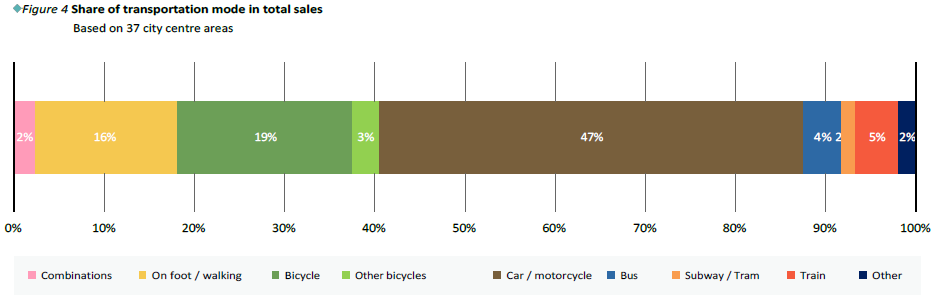
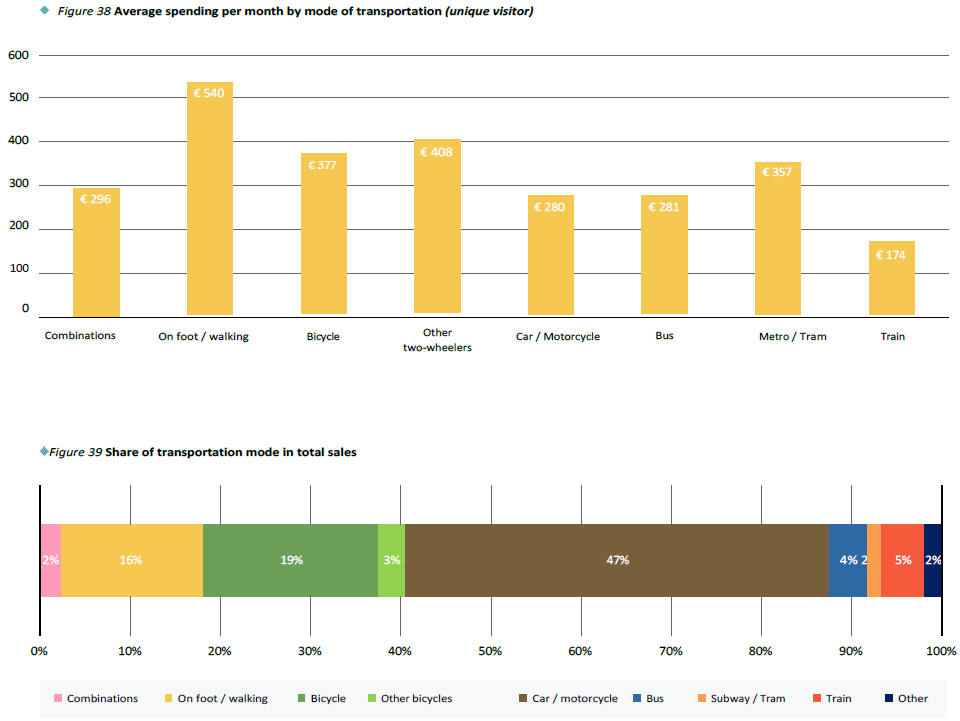
47% of sales are determined by visitors by car.
The pedestrians, cyclists and other bicycles together account for 38%.
Public transport accounts for 11% of total sales.
As indicated earlier, this share varies quite a bit by type of city centre, depending on its nature and size. It will also vary by day and period, but the average gives a good picture of the total.
Average spending per month by mode of transportation (unique visitor)
Share of transportation mode in total sales
Attract your own residents and you're a winner
In many cities there is a task to better balance supply, public space and mobility. Slightly dampening the dominance of the car is often necessary to improve the quality of public space. This is necessary to continue to attract unique visitors, including from the region.
However, again, limiting or strengthening one specific mode of transportation should never be an end in itself. It is about using space more efficiently by freeing up infrastructure space for more attractiveness value in supply and/or public space. It pays economically to attract more of your own residents in particular. These are unique visitors who come relatively often and because of the shorter travel time are more likely to walk and cycle. In short, they spend more.
Moreover, the regional function of many small and medium-sized centres is under pressure: the regional function is shrinking. This is evident from shopping surveys. Policy that strives for more bonding with own residents is therefore important and recommended from multiple perspectives. This also shows the added value of infill development, the addition of new housing, to support the function of a city centre area. The provenance and visiting frequency of a visitor is also related to certain types of spending.
Residents who live in or near a city centre will need facilities that provide frequent purchases and services in addition to recreational shopping. This also fits in with the shift in the function mix of city centre areas: fewer (recreational) stores, more hospitality, (retail) crafts, services and social facilities.
Continue to facilitate car visitors
For larger city centre areas, with a clear regional function, car visitation remains essential for economic functioning. The same applies to smaller centres based primarily on convenience and efficiency, such as weekly (large) shopping.
Continuing to facilitate good car accessibility, good parking facilities and sufficient parking capacity should always remain part of the mobility mix. However, visitors from further away are willing to make a little more effort, as long as the 'cost' of parking is proportional to the 'values' in the city centre area (supply and public space).
Discussions are too often about 'all' or 'nothing': the car must go out or the car must go in. It is much more nuanced. It is ultimately about the right mobility mix relative to supply and public space and liveability. The previously mentioned target group approach to car visitors can also contribute to this.
Economic value of visitors
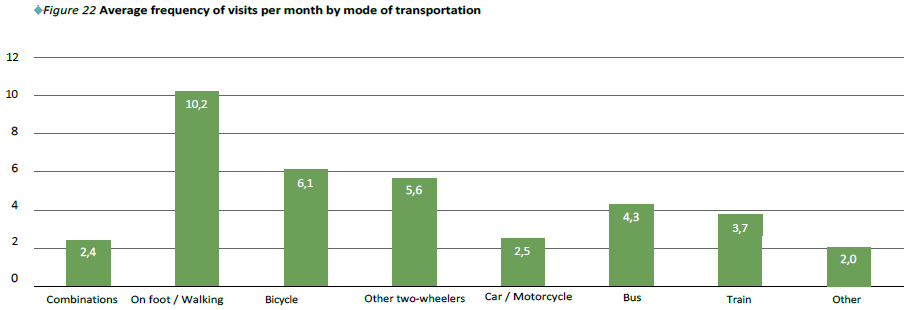
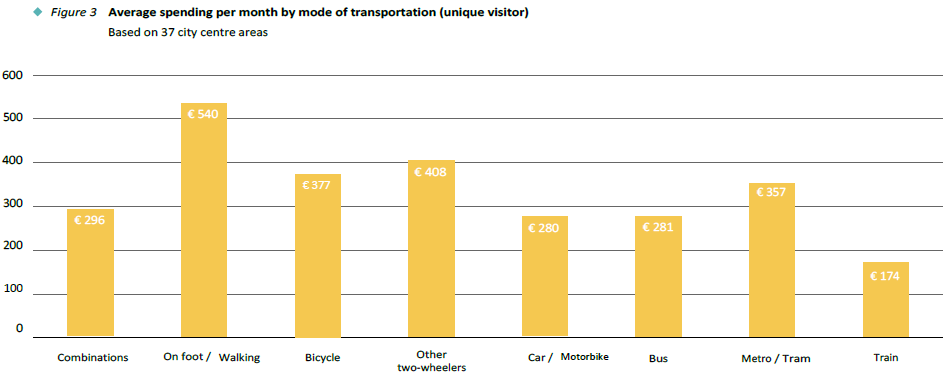
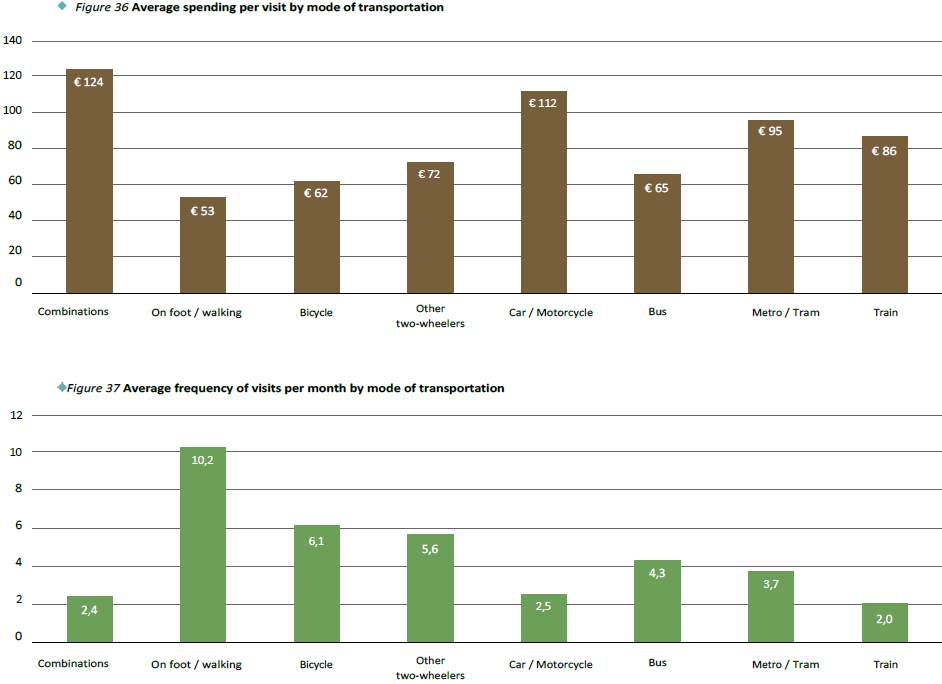
A unique pedestrian yields the most spending. A pedestrian spends little per visit (€53), but visits often (10.2 visits per month), that means a total value of an average of € 540 per month in a city centre area.
This is almost double the value of a unique visitor by car that brings €280 per month to a city centre area on a monthly basis. In other words, one unique pedestrian equals in economic value almost two unique car visitors.
Visitors by bicycle, other two-wheelers and metro/tram are somewhere in between. The other modalities are more comparable to the car in terms of economic value based on unique visitors on a monthly basis.
The train stands out with the relatively low spending value of € 174. Visitors by train spend relatively little and come only very occasionally.
But the car is most important in the share of sales To answer the question of which mode of transportation is most important in total sales, it is not just about the spending of unique visitors on a monthly basis. It is also about the absolute numbers of unique visitors attracted. A city centre which manages to attract proportionately more unique car visitors than unique pedestrians, will, on balance, be more dependent on cars in total sales and vice versa.
On balance, for all centres 47% of sales are determined by visitors by car.
The pedestrians, cyclists and other bicycles together account for 38%.
Public transportation accounts for 11% of total sales.
Average spending per visit and average frequency of visits by mode of transport
Average spending per month by mode of transportation (unique visitor) and share of transportation in total sales
Other information
Please review this research for more information such as:
Visit motive (chapter 3.3): (Recreational) shopping is by far the most important visit motive for large inner cities. This is also related to supply. The larger the city centre, the greater the diversity of visiting motives.
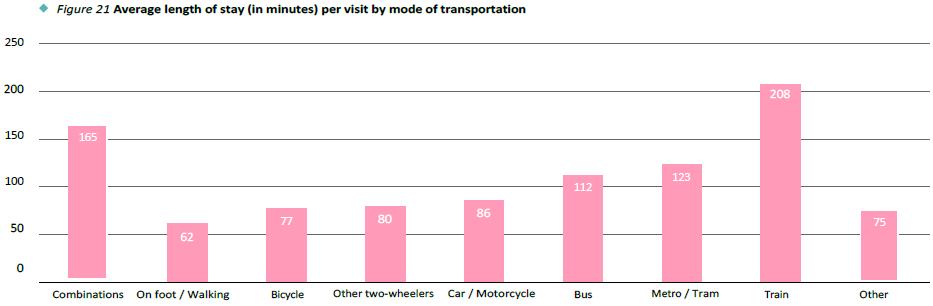
Length of stay (chapter 3.4): In general, the larger a city centre the longer visitors stay. Logical, as there is also more to do.
Visit frequency (chapter 3.5): In general, the larger a city centre the lower the frequency of visits. This is related to the supply, the nature of the visiting motive and the willingness to travel further.
Means of transportation (chapter 4.1): Visitors use remarkably few combinations. Only in the really big city centres is this the case. Usually the combination of car and public transport is mentioned (P+R).
Loyalty
Length of stay
Frequency
Spending by mode of transportation (chapter 6.1)
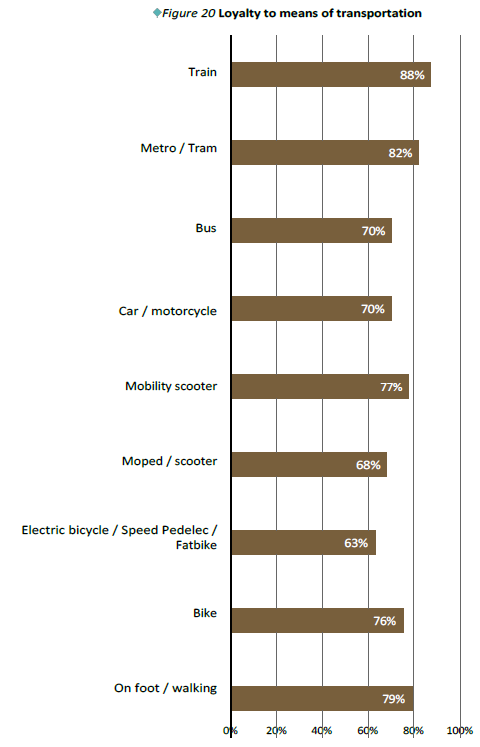
Loyalty to means of transport
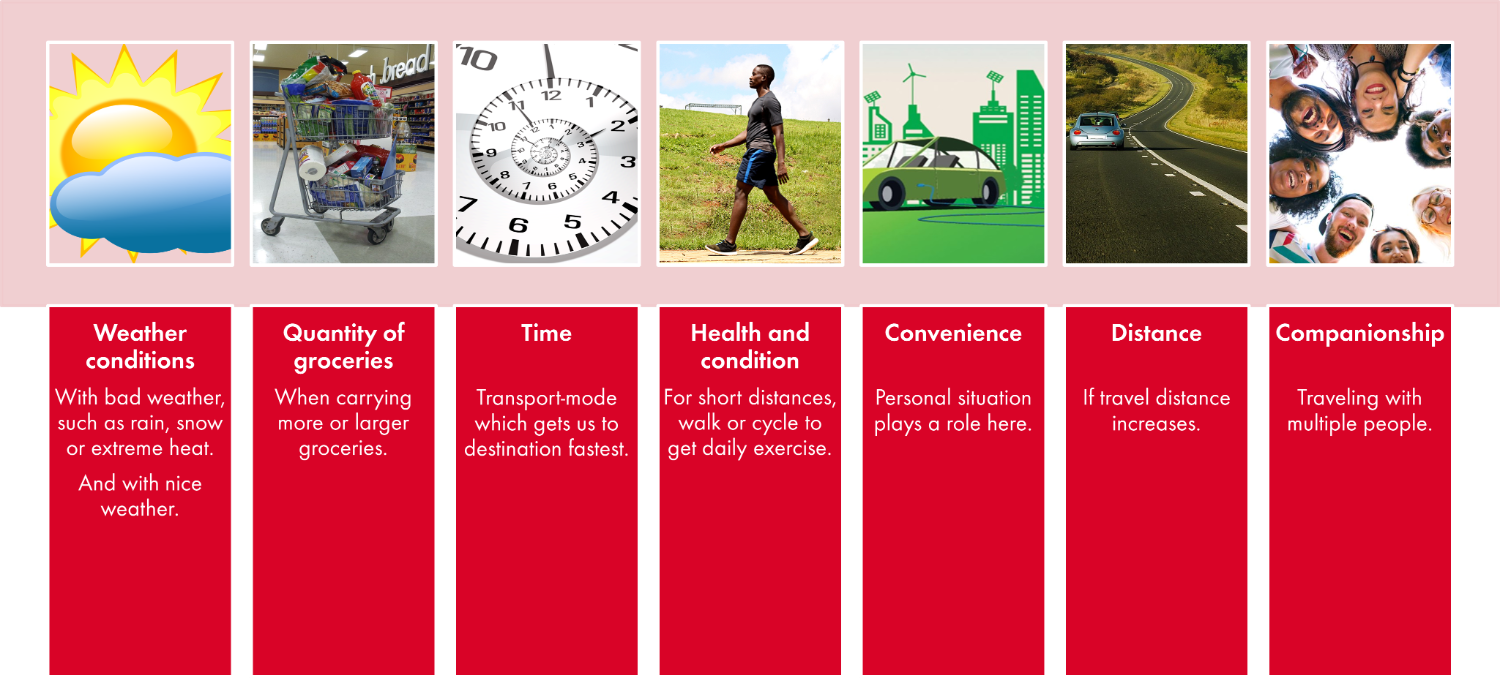
Why do visitors switch transport-mode?
Average length of stay (in minutes) per visit by mode of transport
Average frequency of visits per month by mode of transport