Municipal mobility plans challenged by expanding car fleet
Cars are the primary means of personal mobility, except perhaps in the Netherlands where there are more bicycles than inhabitants. The average person in Europe travels more than 12,000 km by car each year. Personal mobility enables people to participate in society, especially those living in remoter areas, the elderly and people who cannot use public transport.
Passenger car travel enables home care and medical assistance to be delivered when needed and also make a range of other emergency services available to all. Job-related mobility is perhaps the most important, as about half of all passenger vehicle kilometres travelled in Europe are for work.
How big is Europe's passenger car fleet?
According to the EU, reducing reliance on cars in cities is essential for decarbonising the urban landscape and for meeting climate change commitments. However, despite initiatives at EU, national and municipal level, the number of passenger cars on the roads continues to rise.
Although new car sales have not returned to their 2019 pre-pandemic peak, the overall passenger car fleet continues to expand. This trend reflects increased vehicle longevity, with cars remaining in use for longer.
The following chart illustrates these three related trends in the EU passenger car fleet: average age, sales of new vehicles and total fleet size.
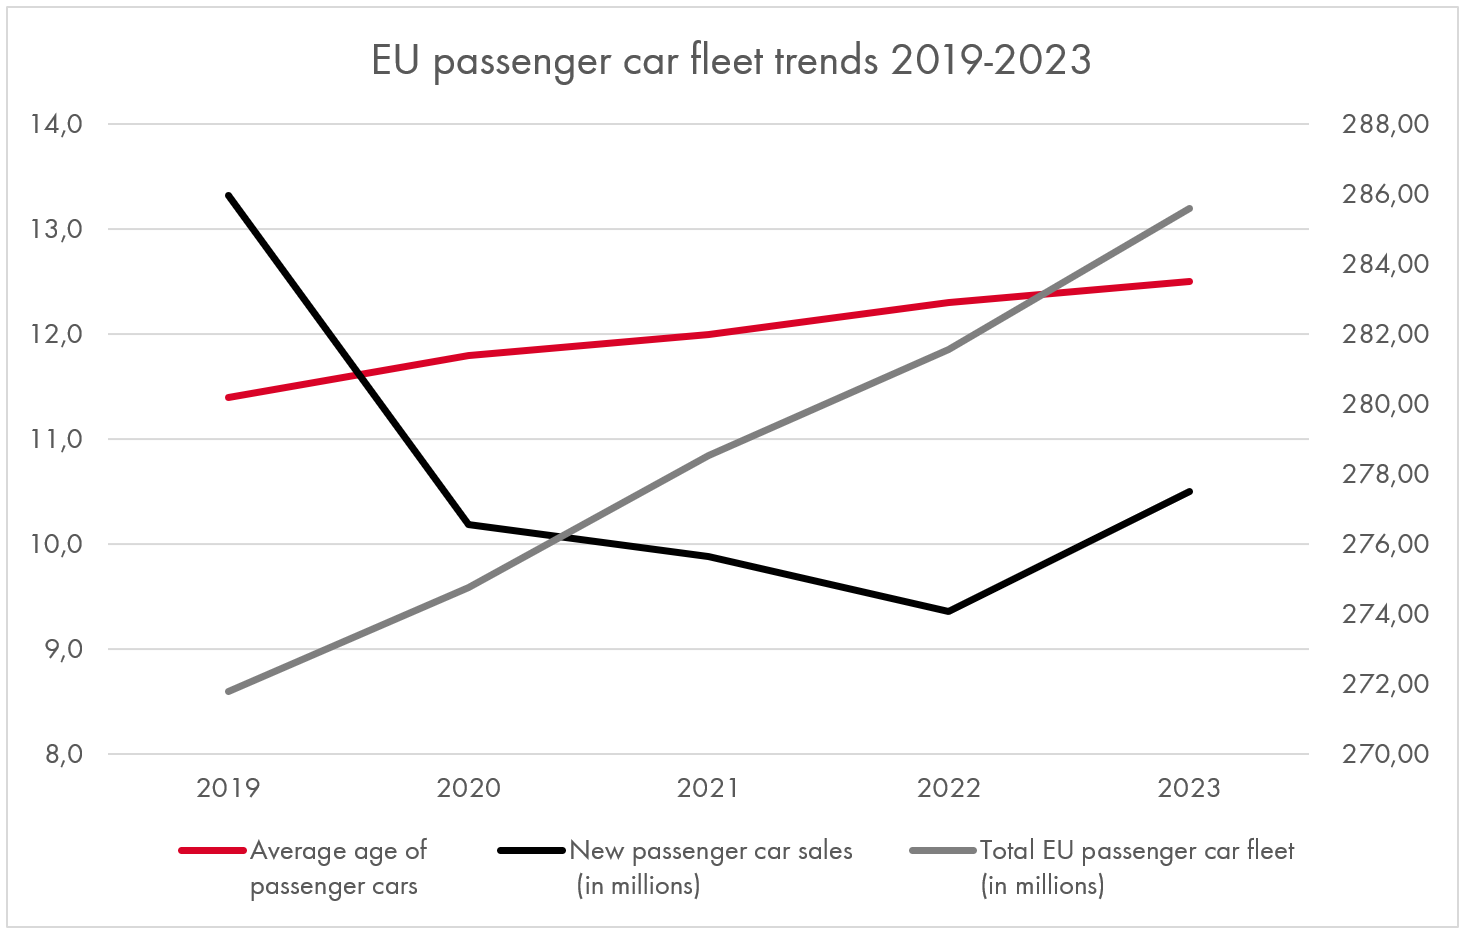
EU passenger car fleet trends 2019-2023
The average age of passenger cars in the EU now exceeds 12.5 years, compared to less than 11 years in 2013. Fleet age varies considerably across member states: in Greece and Estonia, passenger cars are around 17 years old on average, whereas Luxembourg has the youngest fleet, at just 7.9 years.
Passenger car fleet electrification
Efforts to electrify the European passenger car fleet are progressing slowly. Many governments have introduced tax incentives for battery-electric vehicle (BEV) ownership and to expand charging infrastructure, yet concerns about charging availability and convenience persist.
As the BEV market matures, the total cost of ownership in 2025 is becoming more favourable compared to traditional internal combustion engine (ICE) cars, especially in countries where fuel prices are high and other incentives remain in place.
Charging point availability
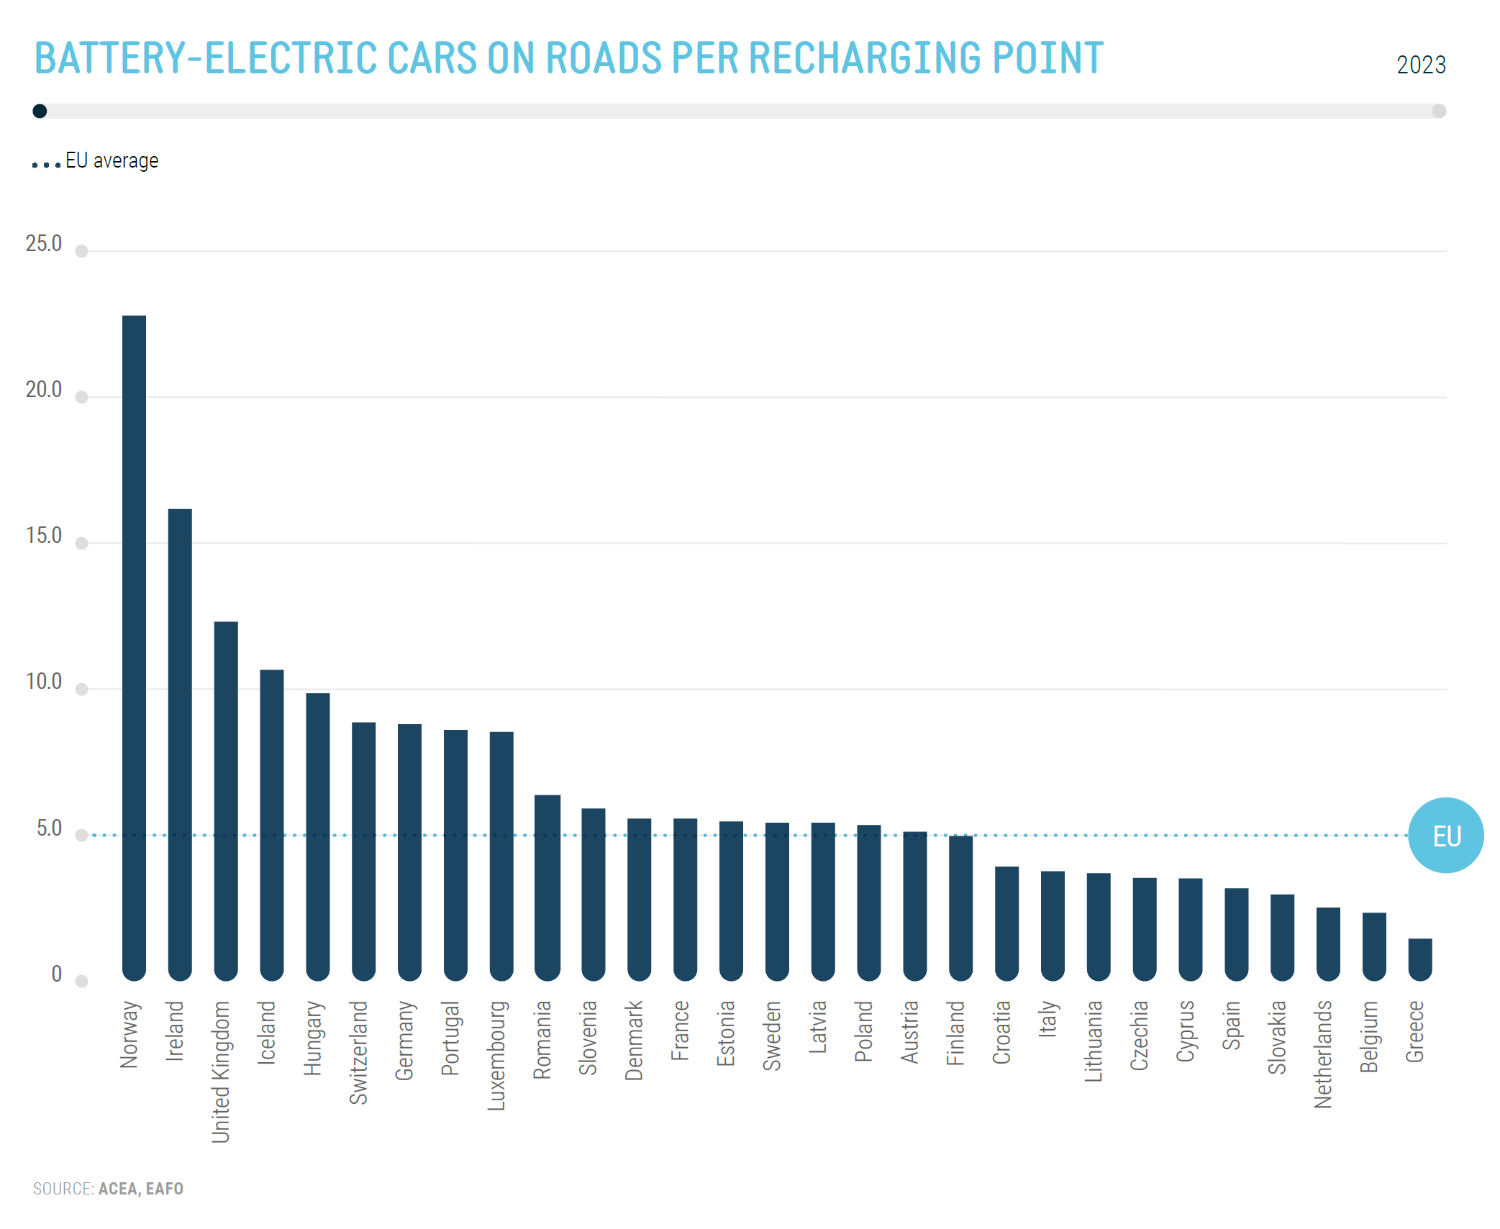
BEVs per public charging point in the EU, 2023
In 2023, there was an average of one public EV charging point for every five BEVs in the EU. And in 2024, there were less than two public charging points per 1,000 inhabitants.
However, public charging points are not distributed evenly throughout the EU: France, Germany and the Netherlands account for some 60% of all EU public charging points. Norway has the most BEVs per charging point while the Netherlands is at the other end of the scale with the fewest BEVs per charging point.
The Netherlands has the most extensive EV charging infrastructure in Europe with the most public charging points per 1,000 inhabitants.
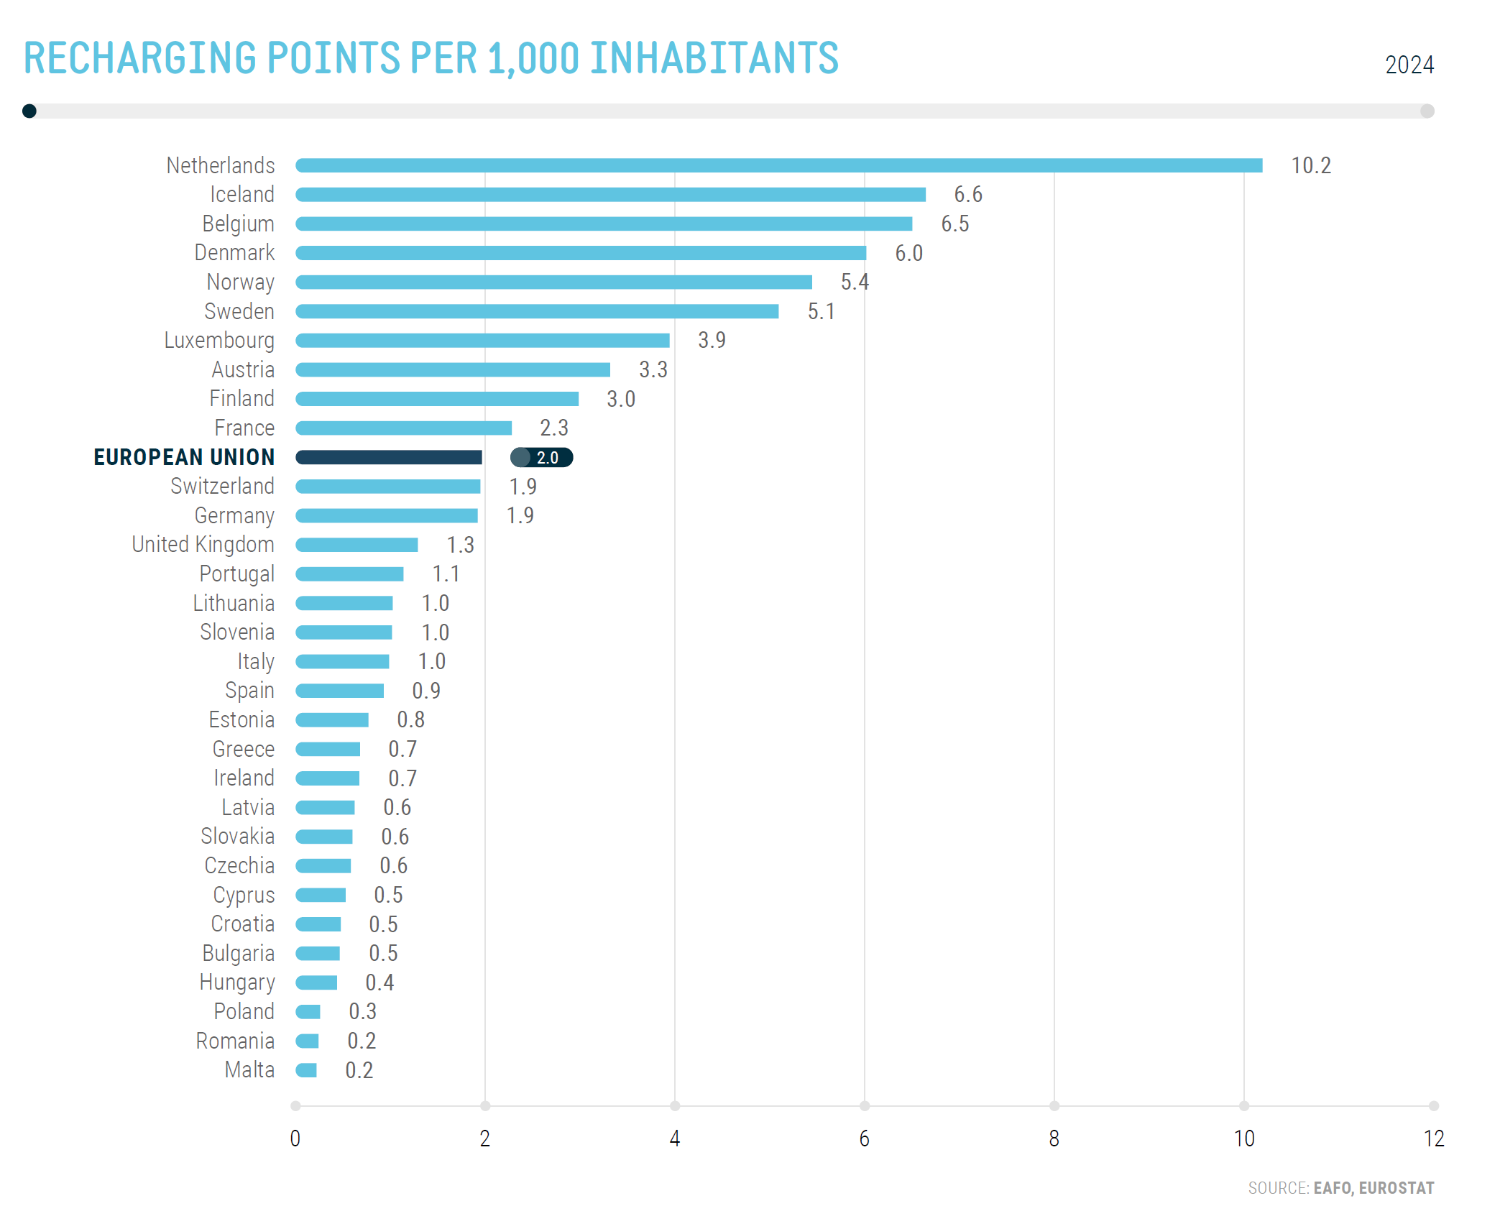
Public charging points per 1000 inhabitants in the EU, 2024
How can cities remain liveable and accessible?
Increasing numbers of cars on the roads puts additional pressure on the accessibility of towns and cities and mobility options for residents. It is common for even the smallest towns to have pedestrian only zones, with access restrictions for deliveries. And many cities have introduced congestion charging or access restrictions such as low-emission and/or limited traffic zones.
But people still need to travel into these areas for work, medical care and leisure. Public transport does not fulfil all individual transport needs. See our Call for a mobility revolution article. This adds urgency to the mobility transition.
Q-Park supports cities with the energy and mobility transition
We help cities manage the ever-increasing numbers of cars on their streets. We help them implement their sustainable urban mobility plans (SUMPs) and address transport and mobility related challenges such as congestion and parking, air and noise pollution, climate change, alternatives to fossil fuels, urban expansion and decreasing public budgets.
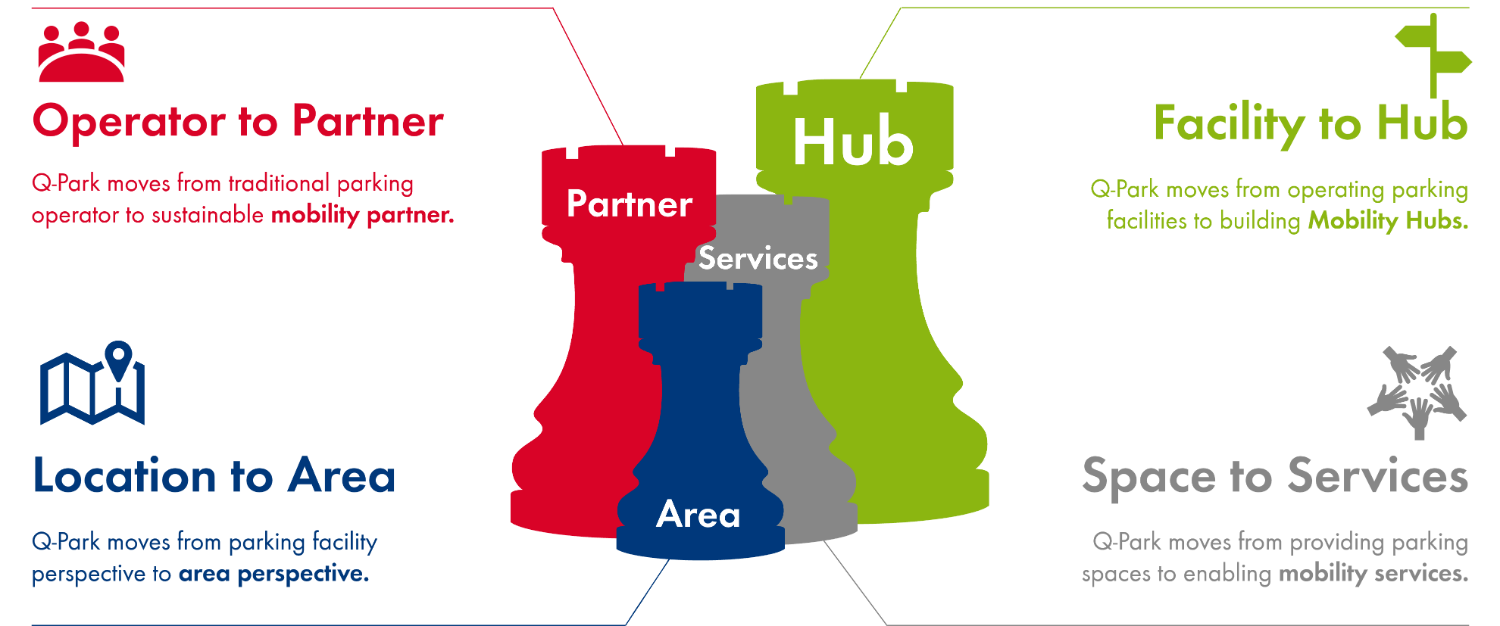
Q-Park’s Sustainable Mobility Partner (SMP) model
With increasing numbers of battery electric vehicles (BEV) and plug-in hybrid electric vehicles (PHEV) throughout Europe, demand for charging infrastructure continues to grow.
Q-Park has many parking facilities at strategic urban locations, such as in or near multifunctional inner-city areas, at or near major transport stations, and at hospitals. This means we can play a key role in facilitating EV charging.
As part of our Energy Portfolio Management programme, we continue to install EV charging points in our parking facilities. In 2024, we added more than 2,700 charging points, bringing the total almost 7,000, with which we enabled some 77.7 million zero-emission kms. By the close of Q2 2025, we made almost 8,800 charging points available in our parking facilities.
Sustainable Mobility Partner (SMP) with more than 25 years' experience
We help cities facilitate personal mobility by combining parking facilities with other services at mobility hubs. Here we connect travellers with sustainable mobility partners who offer alternative ways of getting around the city. These might include public transport, car and bicycle sharing options (including rental), secure bicycle parking, charging stations for electric cars and bicycles, and bicycle lockers for e-bike batteries.
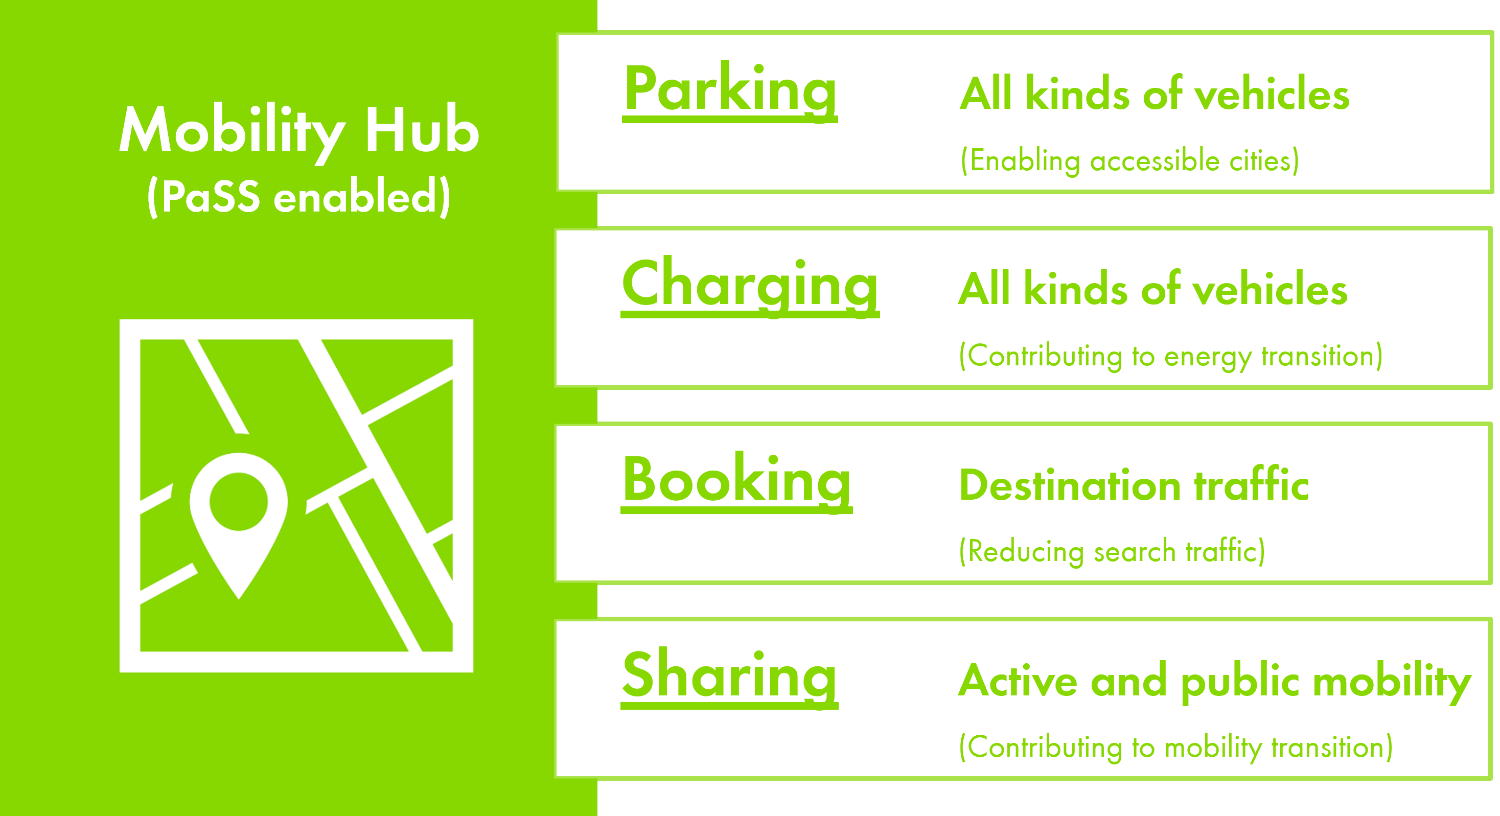
Mobility Hub – the pillar of Q-Park's SMP strategy
Our mobility hubs offer a range of services in addition to parking and provide urban solutions for accessibility and liveability:
enabling passenger cars, scooters and bicycles to park off-street;
enabling electric vehicles (cars and bicycles) to charge off-street;
transforming search traffic to destination traffic with pre-book options;
embracing (micro-)mobility providers with share concepts in our assets.
Click here to our Sustainable Mobility Hub video - Q-Park Park Lane, London UK
Sources: ACEA https://www.acea.auto/ European Automobile Manufacturers’ Association, ACEA Pocket Guide 2025-2026
EAFO https://alternative-fuels-observatory.ec.europa.eu/ European Alternative Fuels Observatory
European Environment agency: https://www.eea.europa.eu/en/circularity/sectoral-modules/product-lifespans/evolution-of-the-average-passenger-car-age-in-the-eu-between-2013-and-2022